Expertise
Pedestrian Flow Studies
Designing walkable cities for residents and users is a challenge that we, at Systematica, promote, develop and validate through scientific evidence and intensive research. Walkability represents the basic ingredient for sustainable development and growth.

People are them among the most important actors who define, with their occasional and systematic movements, the multi-fold pattern of mobility flow.
Systematica had been studying pedestrian mobility on a number of challenging and complex projects, assessing and modelling existing and future pedestrian flows. For this purpose, Systematica utilises pedestrian simulation tools, for all types of pedestrian flow analytical studies in critical environments, with significant pedestrian traffic volumes in complex buildings and places, such as transport nodes, high-rise buildings, sport and cultural events, fairs, museums and exhibitions, and several others.
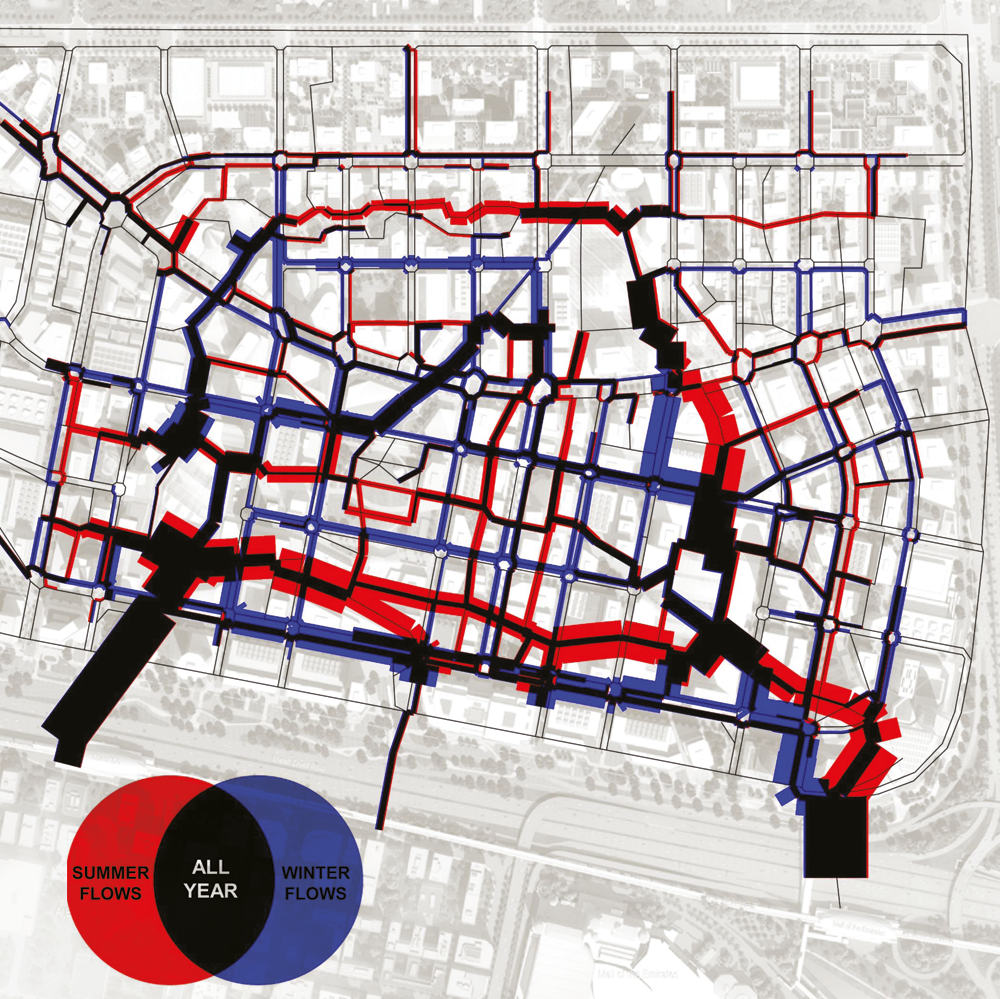
Pedestrian simulation tools reproduce pedestrian movement patterns, with an accurate virtual reconstruction of the physical space to represent paths, obstacles and connecting devices. Pedestrian traffic demand surges and layout changes are modelled and analysed for establishing a comparative basis of different layout options and for validating design decisions, sizing of circulation paths, control devices and aggregation space, and for quantifying capacity limits.
Another objective of the Pedestrian Flow Studies is also to assess both physical and psychological conditions of pedestrian users based on accurate measurements of their capability and agility to move in space. Spatial capacity and performance levels can hence be measured and all critical layout details highlighted can be mitigated at early design stages through appropriate corrective measures.
The results of simulations can be analysed graphically through 3D animations, colour coded performance maps, statistical reports and graphs, all of which are excellent for sharing results with a technical and non-technical audience.